Crossover for mid-tweet
I loaded the measured data into the ACD (Active Crossover Designer) spreadsheets. I completely skipped any attempt to get my SPL data to be minimum-phase, and I also skipped the ACD step of using a summed-SPL measurement and then playing with individual driver delays to find the acoustic centre distances or offsets. I already have phase-aligned SPL measurements of tweeter and midrange from the measurement exercise described above, so I don't need those things.
I started tweaking with filters. Progress was meandering, with a lot of back-and-forth movement and experimentation. I will keep that process aside, and try to illustrate the steps in a more systematic narrative, to explain the crossover, not the actual experimentation process.
The initial state of the SPL curves
This is what the SPL curves looked like in ACD when I loaded the raw FRD files into the spreadsheets: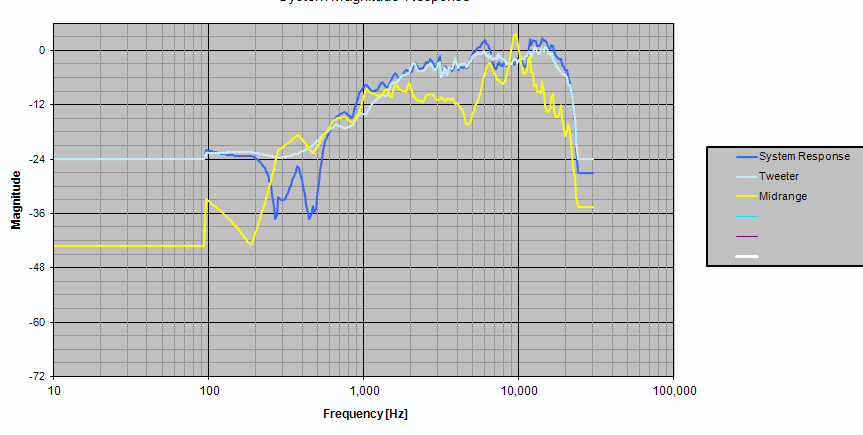
At this point, things look scary and impossible to tame.
Step 1: tame the midrange cone breakup
I applied two notch filters to cut down the midrange driver's cone breakup and push them down as much as I could. I did a wide 20dB cut, Q=0.3, at 10KHz and another narrower 10dB cut, Q=0.7, at 7KHz to arrive at this picture.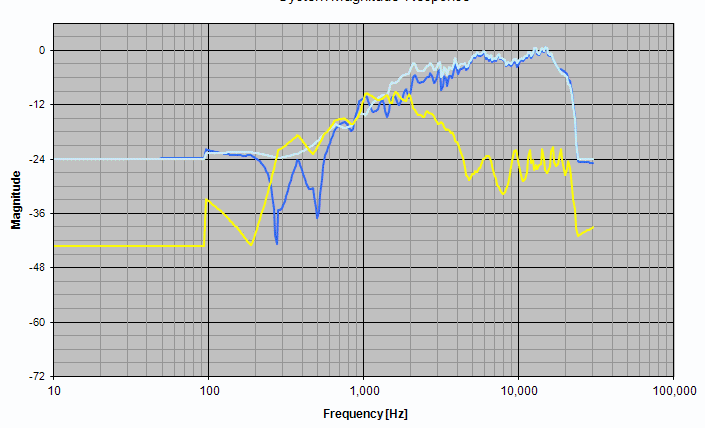
Step 2: the low-pass for the midrange
Next I applied two cascaded second-order filters to get the low-pass filter on the midrange. The final figure of Q and frequency were not arrived at by magic -- they were the result of a lot of tweaking which happened later. But for the purposes of a structured narrative, let us assume that I got some magical inspiration and applied the final values for the low-pass stages. This is what I now see. The cone breakup region has been pushed out of sight, and I am very happy to see them go.
I am only interested in the region of 1KHz to 2KHz in the midrange curve here. Below 1KHz, my gated farfield measurements are showing me some invalid zigzag jagged curves -- I will need nearfield data to get that part right. And above 2KHz, the tweeter will take over, so I don't care about the midrange. I intend to cross over to the tweeter at about 1.5KHz, so all I care about is the midrange curve between 1KHz and 2KHz right now.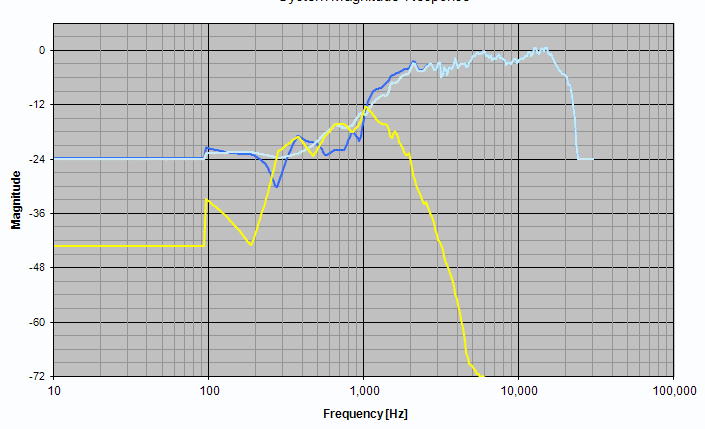
Step 3: bring the tweeter level down
The tweeter is much more sensitive than the midrange and this shows in the relative levels of the two drivers. I put a gain stage with a gain of -7dB to bring down the tweeter level.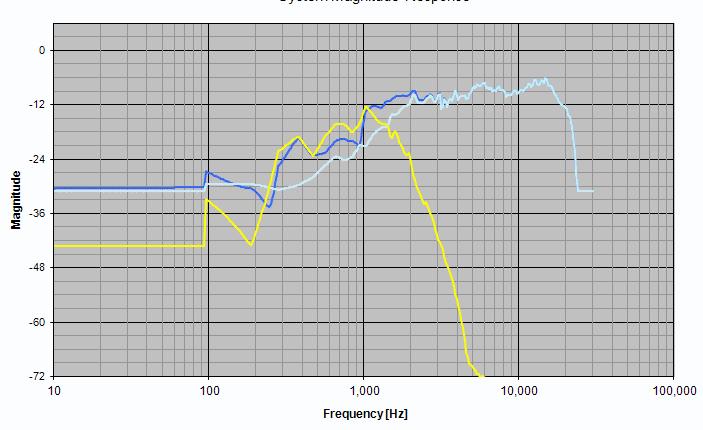
Step 4: high-pass filter on tweeter
Then I apply a high-pass filter, 2nd order electrical, on the tweeter. Given the already prominent acoustic rolloff of the tweeter, I figure that a second-order electrical filter will be fine.
All of a sudden, the summed SPL curve (dark blue line) between midrange and tweeter is showing a promising flatness. The critical region between 1KHz and 2KHz looks promising. My spirits are rising.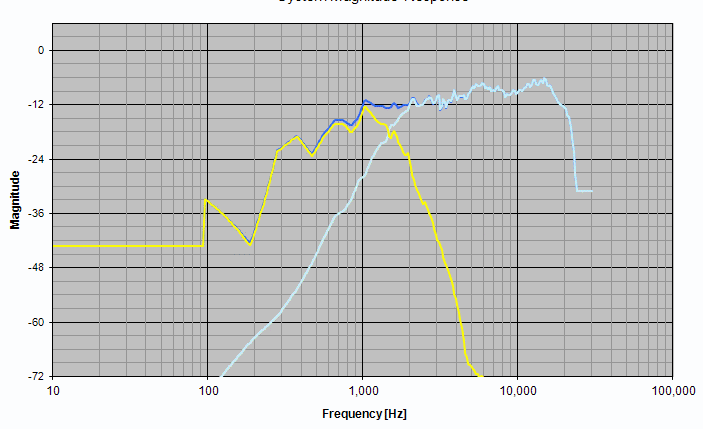
Step 5: shelving filter on tweeter
I now want to tame the rise in the tweeter's SPL curve beyond 4KHz. I try a first-order shelving filter from 5KHz to 10KHz, and this is what I get. The top-end is tamed all right, and things look very polite and disciplined.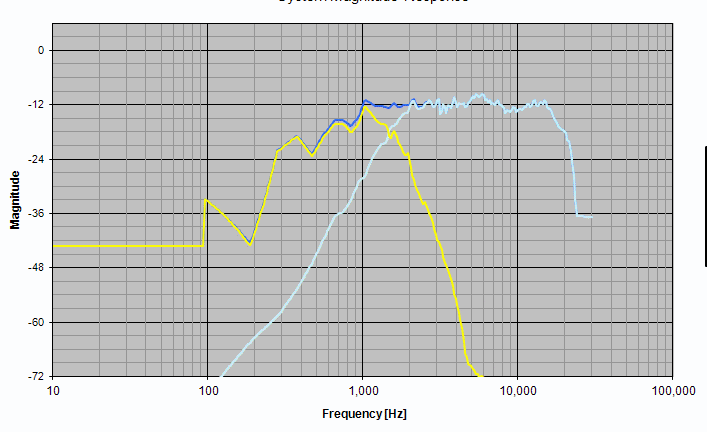
Step 6: shelving filter tuning
By studying the curves, I figured that the shelving filter is making things a bit too tame. A bit of rise in the tweeter between 10KHz and 20KHz is not a totally bad thing, specially if I will be listening somewhat off-axis most of the time. This region can take a bit of rise, and adds a bit of "air" to the sound, a touch more detail, without adding any harshness or changing the tonal balance of the sound. So, I decide to tone down the shelving filter a bit, allowing the SPL to rise a bit. I change the range from 5KHz-10KHz to 5KHz-7KHz. And this is what I get.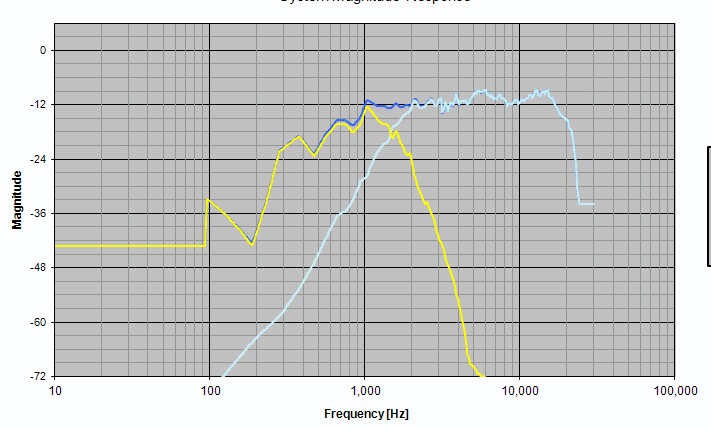
Step 7: the tweeter peak at 6KHz
What remains now is the tweeter's peak at 6KHz. This will definitely be audible, and I would rather tame it a bit. I play around with the parametric equaliser, and put a notch centred at 6KHz. I play with the amount of cut (between -1dB and -2dB seems good) and the Q (I try values of 0.5, 1, etc). I finally settle for something like -2dB and Q=1.0.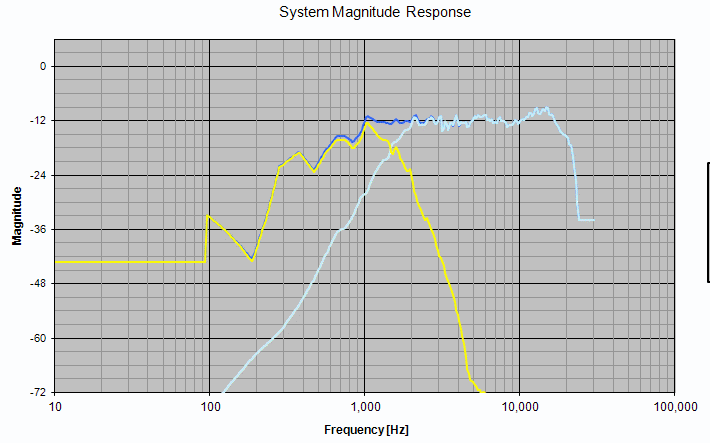
The reverse notch
After this, I flipped the polarity of one driver, to see if I was getting a good, deep notch. A notch tells you that the summing of the two drivers on the mic axis is working well, and the power output is not "lobing" upwards or downwards". Slight differences in phase of the two drivers will drive the power output vertically up or down, away from the mic axis (i.e. away from the listener's head). This causes subtle complications.
But I did not get a deep notch. Evidently, the mixture of filters I had applied had driven the drivers into a subtly out-of-phase state at the crossover point.
So I played with adding delay to the midrange. I tweaked all sorts of values, keeping an eye on the reverse-null depth. I finally landed up getting a decent null if I chose to reverse the polarity of one of the drivers, and adding a small delay (a quarter millisecond) to the midrange.
Here is the summed SPL. One driver is wired with reverse polarity to get this total response.
When both the drivers are connected with the same polarity, then this is the anti-phase null I am getting:
It is more difficult to model a crossover using ACD than with "normal" speaker modelling products (Speaker Workshop, LspCAD, SoundEasy) because there is no goal setting and auto-optimisation available here. You have to tweak each value by hand endlessly and keep looking at the SPL curve. But the whole setup works, and for the price (free!), this is the only crossover design and modelling tool I know of which allows you to model active line-level analog crossovers.
Getting the driver phase right with minimum offset
I played around with the time delay and tried to see if I could arrive at the anti-phase null without flipping the polarity of one of the drivers. I finally managed to do it, delaying the tweeter by 0.06 msec instead of the midrange, and keeping the drivers with identical polarity. I am much happier with this, because the time delay is much smaller than the earlier case (about one-fourth) and the drivers are in same polarity. I am not showing any new SPL curves, because they look almost identical to the earlier ones.
The woofer-mid crossover
I needed to tackle this beast, and I need to verify the acoustic rolloff of each of these drivers in its own sealed chamber. My nearfleld measurements gave me that picture. Now for the crossover.
I was clear that I wanted to do a simple fourth-order or sharper crossover, and leave it at that. I do not feel that it matters whether the resultant acoustic rolloff at these low frequencies is 24dB/oct or 32dB/oct or something else.
But I knew I would have to take these SPL curves into ACD and get MiniDSP biquads for at least the midrange driver, because the MiniDSP configuration application allows you to either work with raw biquads or in the "Basic" mode with simple crossover specifications. My upper-end filter (the low-pass) for the midrange was complex and subtle enough for me to need biquads -- the "Basic" mode would not do. So I would need biquads for the lower-end filter (the high-pass) too. Therefore, I thought -- why not try to take the combined nearfield+farfield measurements into ACD and see what the filters looked like in the modelled SPL curves?
Splicing the midrange curves
Splicing the nearfield and farfield curves is not as easy as clicking "OK". You have to manually match the levels of the two curves, and then experiment with the splicing frequency, before you can get something which looks good.
My farfield measurement of the midrange had sensible data from 1 KHz onwards. Below 1 KHz, it was rolling off in an unacceptable manner. I decided to splice the nearfield data at some point near the 1 KHz mark.
But my nearfield data had some unrealistic peaks which were (I am told) the result of measurement artifacts. Therefore, 1 KHz seemed to be a very unstable spot, since both graphs were showing problems at this point. So I made various attempts to get the SPL to match and splice at various frequencies from 840 Hz to 1 KHz, to see what I could get. Finally, this is what I got.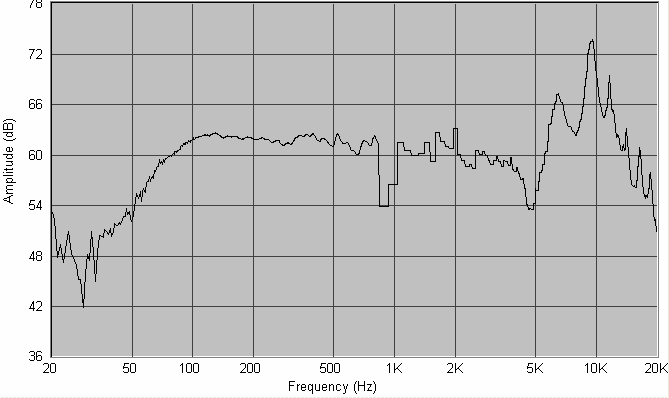
This one has a major crevasse in the 850Hz - 1KHz range, but I decided to ignore this completely. After all, I was doing all these things to get the mid-woofer crossover done. I did not need to look at the curve at 1 KHz while working on the mid-woofer crossover.
Adding the woofer into the picture
I now needed to load the woofer curve into ACD. This would be entirely the nearfield data; I could completely ignore the higher frequencies in this curve, knowing that they were probably invalid, because I only needed to design a crossover at 150 Hz.
So I loaded the woofer curve into ACD. But the absolute levels of the midrange and woofer curves were diverging hugely, due to all these inconsistent and independent measurements. (When you measure two drivers and move the mic in between, or change gain settings, then their relative SPL values cannot be understood from their SPL curves. This means two nearfield curves of two drivers can't be compared for relative SPL.)
So I decided to do a cross-check of the relative SPL of the midrange and woofer curves, by taking one shot of gated farfield reading and keeping the mic and gain settings unchanged. This is what I got, shown here with midrange and woofer data superimposed: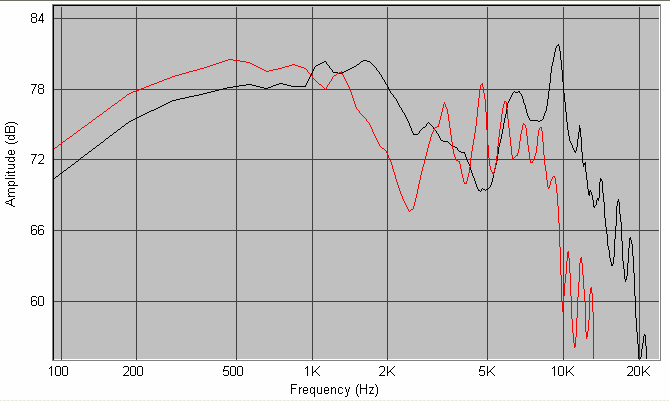
I could see that their relative SPL was roughly similar. More accurate comparison was not needed at this stage, since we are discussing really low frequencies here, and room modes will play a huge part in what the listener actually hears. Those room modes will be tackled later by in-room measurements anyway, so I can safely ignore them here.
Now that I have the woofer and midrange data in ACD, level matched to roughly the same level, I could apply the high-pass filter on the midrange and the low-pass on the woofer, and see what it looked like. This is what it looked like:
Here, I was totally ignoring whatever the graph was showing me as interaction between the midrange and tweeter. The spliced midrange curve did not have the same phase alignment as the original pure-farfield midrange curve, therefore the crossover point between the mid and tweeter was showing jaggies. I ignored that. I paid attention to the woofer-midrange crossover.
The final acoustic rolloff of the mid's high-pass is steeper than that of the woofer, because the natural acoustic rolloff of the mid has been added to the 4th-order electrical filter. The woofer's low-pass, on the other-hand is showing roughly an acoustic 4th-order rolloff, because there was no natural rolloff for the woofer in the 100Hz - 500Hz band.
Ah well. This is as precise as it gets as these low frequencies when building speakers in bedrooms and living rooms. The final in-room behaviour will be something else anyway. I had my crossover, so I plugged them into the MiniDSP and proceeded to build a prototype.
The combined, final picture
The tweeter filters and eq settings now look like this:
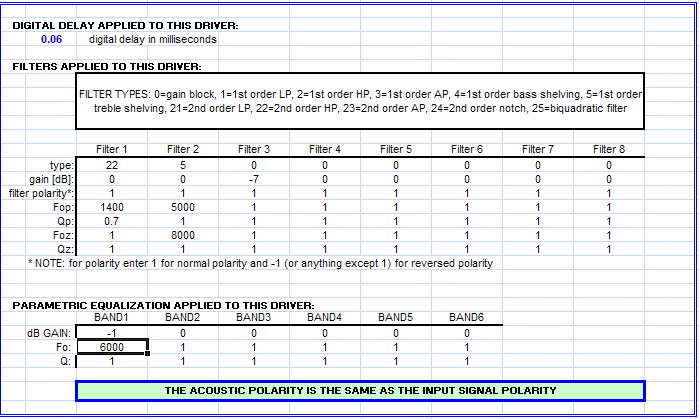
There's nothing sacred about the shelving filter settings or the shallow notch -- they can be tweaked to taste, I guess.
The midrange filters and eq settings look like this:
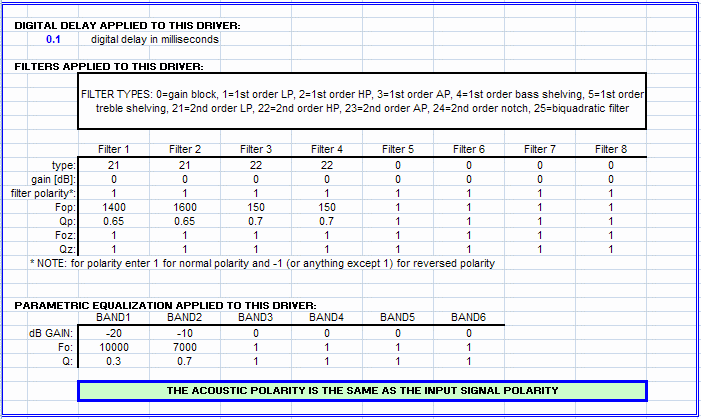
There is a strange 0.1 msec delay on the midrange. This is something I just put in, because it made the mid-to-tweeter crossover look a little cleaner, after I put in the spliced-nearfield-farfield midrange curve with the jaggies at 1 KHz. Maybe I will tweak it after taking final farfield measurements all over again, after the speakers are fully operational.
The woofer filters look like this:
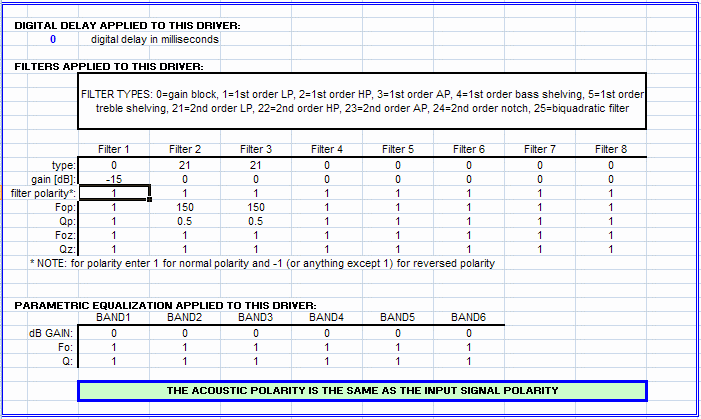
The -18dB gain cut is to be ignored -- it has no real value. It was just put in there to gain-match the woofer visually with the midrange.
And when all this is put together, in a highly contrived modelling setup, this is what I get:
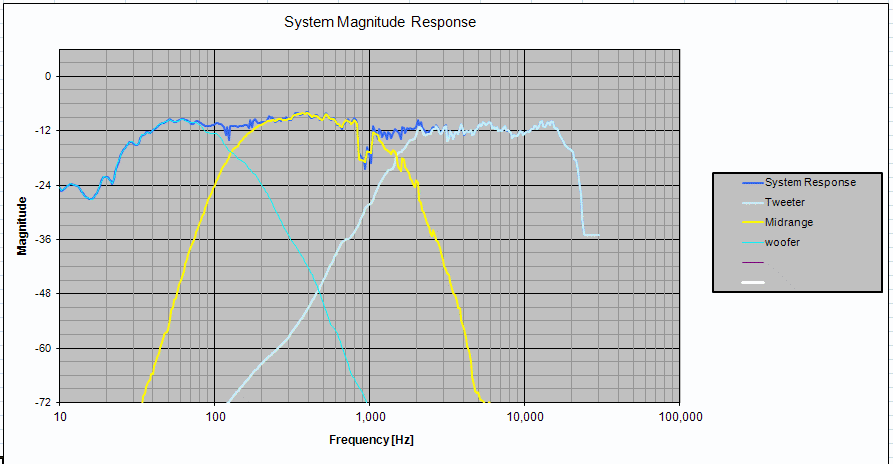
It all looks tolerable. Now for some real-world listening, followed by more measurements.
Baffle step compensation
A bit of listening showed up a very clean sound, with detail but without any harshness. However, one of the most obvious problems was the weak deep bass.
Some heart-burn and some thought later, it became apparent that I had missed one important component of the crossover design: the baffle step compensation. This is a subjective element one must add to the system response, increasing the lower frequencies by anything like 3 dB to 6 dB. Which frequency to start the shelving filter from? This is supposed to be decided by the baffle dimensions, but the Darbari has two dimensions for its baffle. The midrange, which goes pretty low for a midrange, has a baffle width less than a foot. And the woofer has a width considerably more than this.
So I decided to do a first-order shelving filter to raise the response below 300 Hz, up to 150 Hz. That's about a 4-5 dB of rise. I also decided to cut the mid and tweeter response by 4 dB compared to the woofer. Overall, the modelled SPL curve now looked like this:

I listened to this for a few days.
Further enhancement of the lower octaves seemed to be hard to do. I tested the woofer by feeding it a sine wave of 50 Hz, and it seems to bottom out at power levels between 100 W and 150 W. Therefore, it does not have the mechanical construction to handle a lot of low-frequency boost, and I was thinking that I would just let it roll off at its acoustic roll-off point. My box modelling seems to indicate something like a Q of 0.6 or less, which means a gentle roll-off, giving a likelihood that it will fit in well with the room gain which the in-room responses will have.
| Prev: Measurements | Next: Crossover tuning |
